Picture this: You’re sitting in a coffee shop, sketching out your brilliant business idea on a napkin. Your friend leans over and asks the question that stops every entrepreneur in their tracks:
“So… how big is this thing really?”
Here’s the brutal truth. CB Insights found that 70% of startups fail because they never figured out their market size. They built amazing products for markets that were either microscopic, completely saturated, or—plot twist—didn’t actually exist.
I’ve seen this mistake destroy promising companies. Brilliant founders with game-changing products who couldn’t answer that one simple question about market opportunity.
Your Total Addressable Market isn’t some boring number you stuff into slide 12 of your pitch deck. It’s literally the difference between building a lifestyle business and creating the next unicorn. Every major decision you’ll make—whether to pivot, expand, hire, or raise money—depends on understanding this number.
Think about it. Should you build that new feature? TAM will tell you. Ready to enter that exciting new market? Better check your TAM first. Considering raising another round? Investors are going to grill you on market size.
The thing is, most people get TAM completely wrong.
 Key Takeaways
- Total Addressable Market (TAM) represents the total revenue opportunity available if you captured 100% of your market
- Accurate TAM calculation helps secure funding, guide strategic decisions, and identify the most profitable growth opportunities
- Use multiple calculation methods (top-down, bottom-up, value theory) to validate your market size estimates
- Segment your TAM into Serviceable Addressable Market (SAM) and Serviceable Obtainable Market (SOM) for realistic planning
- Regularly update your TAM analysis as markets evolve, new competitors emerge, and customer needs change
That’s why I’ve put together this guide. Not some dry academic exercise, but a practical roadmap that’ll help you calculate your TAM the right way, avoid the mistakes that trip up most entrepreneurs, and actually use this insight to grow your business.
We’re going to dig into the three methods that actually work. I’ll show you real examples from companies like Airbnb and Tesla who used TAM analysis to justify massive investments. You’ll get the tools and frameworks I use with my own clients.
By the time we’re done, you’ll know exactly how big your opportunity really is. More importantly, you’ll know what to do about it.
Ready? Let’s figure out the size of your prize.
 Table of Contents
Understanding TAM Fundamentals
So What Exactly Is TAM?
Here’s the simplest way to think about it: TAM is what you’d make if you somehow convinced every single potential customer to buy from you.
I know, I know. That’s never going to happen. But stick with me.
Imagine you built the perfect project management software. Your TAM would be every business on the planet that could use project management tools, times what they’d pay you each year. That’s your theoretical ceiling.
TAM answers the big question: “What’s the size of the prize?”
It’s not about what you will make. It’s about what’s possible. And that distinction matters more than you think.
Why This Actually Matters (Beyond Impressing Investors)
Look, I get it. TAM feels like business school homework. But here’s why smart entrepreneurs obsess over this number:
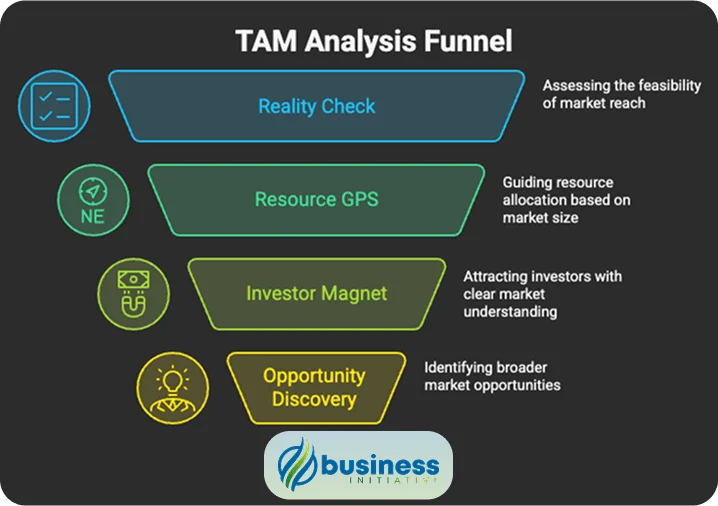
It’s your reality check. I’ve watched founders spend two years building products for $10 million markets when they could have targeted $1 billion opportunities instead. The effort is the same. The outcome? Completely different.
It’s your resource GPS. You’ve got limited time, money, and energy. TAM tells you where to point that precious firepower. Should you build that new feature? Depends on how much it expands your TAM. Worth hiring that expensive sales director? Better know if the market can support their salary.
It’s your investor magnet. VCs see hundreds of pitches every month. The ones that get funded? They have founders who clearly understand their market opportunity. Not just the product—the entire universe of customers who could buy it.
It reveals hidden opportunities. When you really dig into TAM, you start seeing markets differently. Maybe you thought you were building accounting software for small businesses. But your TAM analysis reveals you’re actually in the business productivity market. That changes everything.
➤ MORE: Use our TAM Calculator
What Happens When You Get This Right
The numbers don’t lie. Companies that nail their TAM analysis don’t just sound smarter in meetings—they perform better:
• Startups with solid TAM research raise 40% more funding on average
• High-growth companies update their TAM analysis regularly (67% do it quarterly)
• Businesses with accurate TAM hit product-market fit 3x faster—within 18 months
Here’s my favorite example of TAM thinking in action. Uber started by calculating the taxi market: $4.2 billion in the US. Not terrible, but not exactly venture-scale either.
Then they had their lightbulb moment. What if they weren’t just in the taxi business? What if they were in the transportation business? Suddenly their TAM exploded to $87 billion globally.
That shift in thinking—from “taxi replacement” to “transportation platform”—justified everything that came next. The billions in investment. The global expansion. The move into food delivery and freight.
All because they understood their real market opportunity.
TAM Calculation Methods
Method 1: Top-Down (The “Industry Report” Approach)
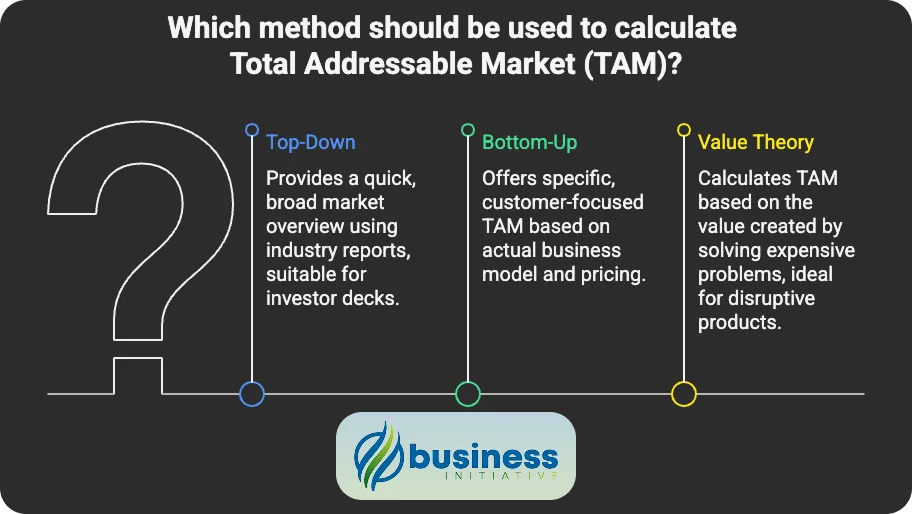
This is where most people start, and honestly, it’s the easiest. You find some fancy Gartner report that says “The global CRM market is $69.8 billion,” then you figure out what slice belongs to you.
Here’s how it works:
- Grab industry data (the bigger the source, the better)
- Figure out what percentage actually applies to your business
- Do some basic math
Let’s say you’re building CRM software for small businesses:
- Global CRM market: $69.8 billion
- Small business segment: 28% of that market
- Your TAM: $69.8B × 0.28 = $19.5 billion
When to use this: Perfect for investor decks and getting a quick sense of market size. Especially good when you’re in an established market with lots of research available.
The catch? These reports can be wildly off. They’re making assumptions about your specific market that might not hold true. Plus, they often inflate numbers because… well, bigger numbers sell more reports.
Method 2: Bottom-Up (The “Count Your Customers” Approach)
This is my favorite method because it forces you to get specific about who actually wants your product. Instead of trusting some analyst’s broad market estimate, you build up from the customers you know you can serve.
Here’s the process:
- Define exactly who your ideal customer is
- Count how many of these customers actually exist
- Figure out what they’d pay you annually
- Multiply and boom—there’s your TAM
Real example: Let’s say you’re targeting US companies with 100-1000 employees for your HR software:
- Companies in that size range: 200,000
- What they’d pay you per year: $5,000
- Your TAM: 200,000 × $5,000 = $1 billion
Why I love this method: It’s based on your actual business model and pricing. You can validate every assumption by talking to real customers. No mysterious analyst reports required.
The bottom-up approach also makes your go-to-market strategy obvious. You know exactly who to target and how much they’re worth.
Method 3: Value Theory (The “What’s It Worth?” Approach)
This one’s for the disruptors. Instead of looking at existing markets, you calculate TAM based on the value you create. It’s perfect when you’re solving a problem that’s expensive but doesn’t have an obvious “market size.”
The logic is simple:
- Find a painful, expensive problem
- Calculate what that problem costs companies
- Figure out how much of that cost you can eliminate
- Estimate what share of that value you can capture
Here’s how it might work: Let’s say manual data entry costs businesses $5,000 per employee per year (lost productivity, errors, etc.). You’ve built automation software that eliminates 80% of that waste.
- Target: 50,000 companies with 20 employees each
- Problem cost: $5,000/employee/year × 20 employees = $100,000/company/year
- Total market pain: 50,000 companies × $100,000 = $5 billion annually
- You capture 20% of the value you create
- Your TAM: $5B × 0.20 = $1 billion
When this works best: Revolutionary products, expensive enterprise problems, or markets where you’re creating a new category. It’s also great for justifying why customers should pay premium prices.
The Smart Move: Use All Three
Here’s what I tell every entrepreneur: don’t pick one method and call it done. The magic happens when you use all three and see if they roughly align.
Start with top-down to get the big picture and establish credibility with investors. They love seeing that you understand the broader market context.
Then go bottom-up to build your actual business plan. This is the number that matters for hiring, pricing, and forecasting.
Finally, check your work with value theory. This helps you understand if your pricing makes sense and validates whether customers will actually pay what you’re asking.
When all three methods point to similar TAM ranges, you’re onto something solid. When they’re wildly different? Time to dig deeper and figure out which assumptions are off.
The best founders I know can tell this story: “Industry reports suggest our market is X, our bottom-up analysis shows Y, and the value we create justifies Z. Here’s why these numbers make sense together…”
TAM vs SAM vs SOM: The Market Sizing Framework
TAM: The Whole Enchilada
TAM is everything. Every potential customer on the planet who could theoretically buy your product. It’s what you’d make if you somehow achieved 100% market share and had zero competition.
Think of it as your “if we took over the world” number.
For that project management software example? Your TAM is every business globally that could use project management tools. The whole $7.63 billion market.
This is the number that gets investors excited and justifies those big, hairy, audacious goals.
SAM: What You Can Actually Go After
Here’s where reality kicks in. SAM is the slice of TAM you can actually pursue with your current business model, team, and resources.
Maybe you’re only selling in North America because of regulatory restrictions. Maybe your product only works for small businesses because that’s how you built it. Maybe you’re only targeting English-speaking markets because that’s what your team can handle right now.
SAM accounts for all those real-world constraints.
So instead of the entire $7.63 billion global market, your SAM might be North American small businesses—let’s say $2.1 billion. Still huge, but more realistic given your current capabilities.
SOM: What You’ll Actually Get
Now we’re talking business plans, not dreams. SOM is the piece of SAM that you can realistically capture given the competition, your positioning, and market dynamics.
This is where you ask the hard questions: How much market share can a startup really take from established players? How long will it take customers to switch? What advantages do you have that competitors can’t copy?
If you think you can capture 5% of that $2.1 billion SAM over the next five years, your SOM is $105 million. That’s what you put in your business plan and use for hiring decisions.
SOM is your “being honest with ourselves” number.
Why You Need All Three Numbers
Think of TAM-SAM-SOM as your strategic GPS. Each number serves a different purpose:
TAM is your North Star. It validates that you’re chasing something worth catching and gives investors confidence that the opportunity is venture-scale.
SAM is your strategy. It forces you to be honest about what markets you can actually serve with your current resources and business model.
SOM is your business plan. This is what you’ll actually achieve, and it’s what you base your hiring, pricing, and growth projections on.
I’ve seen too many founders present only their TAM (“We’re going after a $50 billion market!”) without showing they understand the practical realities of capturing any of it. Investors see right through this.
Quick Example: Food Delivery Startup
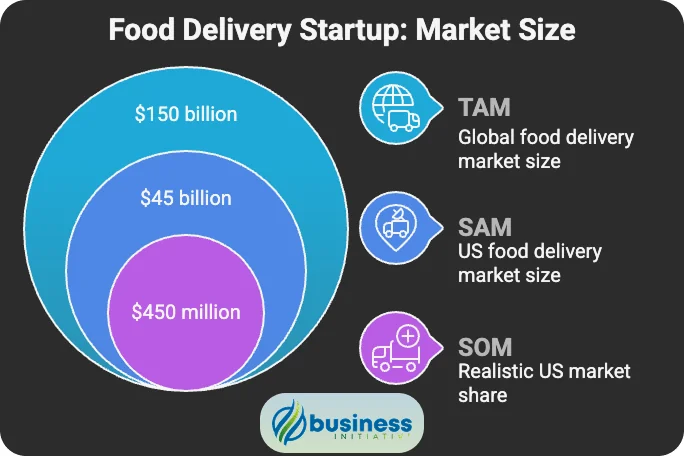
TAM: $150 billion (global food delivery market) SAM: $45 billion (US market only) SOM: $450 million (realistic 1% US market share)
See how each number serves a different purpose? TAM proves the opportunity is huge. SAM shows your actual target. SOM sets realistic expectations.
Basic TAM Calculator
Try this calculator to see how different variables affect your market size calculations. Adjust the sliders to experiment with various scenarios and understand the relationships between key factors.
➤ ADVANCED: Use our advanced TAM Calculator based on real industry data and variables
🚀 TAM Analysis Calculator
📊 Top-Down Method
$100B 15%🎯 Bottom-Up Method
50M $1,000 10%📈 Your Market Opportunity
$100B × 15% × 2% = $300M
50M × $1,000 × 10% = $5B
How to Use This Calculator:
- Adjust the sliders to match your business scenario
- Compare results between top-down and bottom-up methods
- Look for alignment - if your methods are wildly different, revisit your assumptions
- Use the insights to refine your market analysis
This calculator demonstrates why using multiple TAM calculation methods is crucial. When your top-down and bottom-up analyses align, you can be more confident in your market size estimates.
Market Research Techniques for TAM Analysis
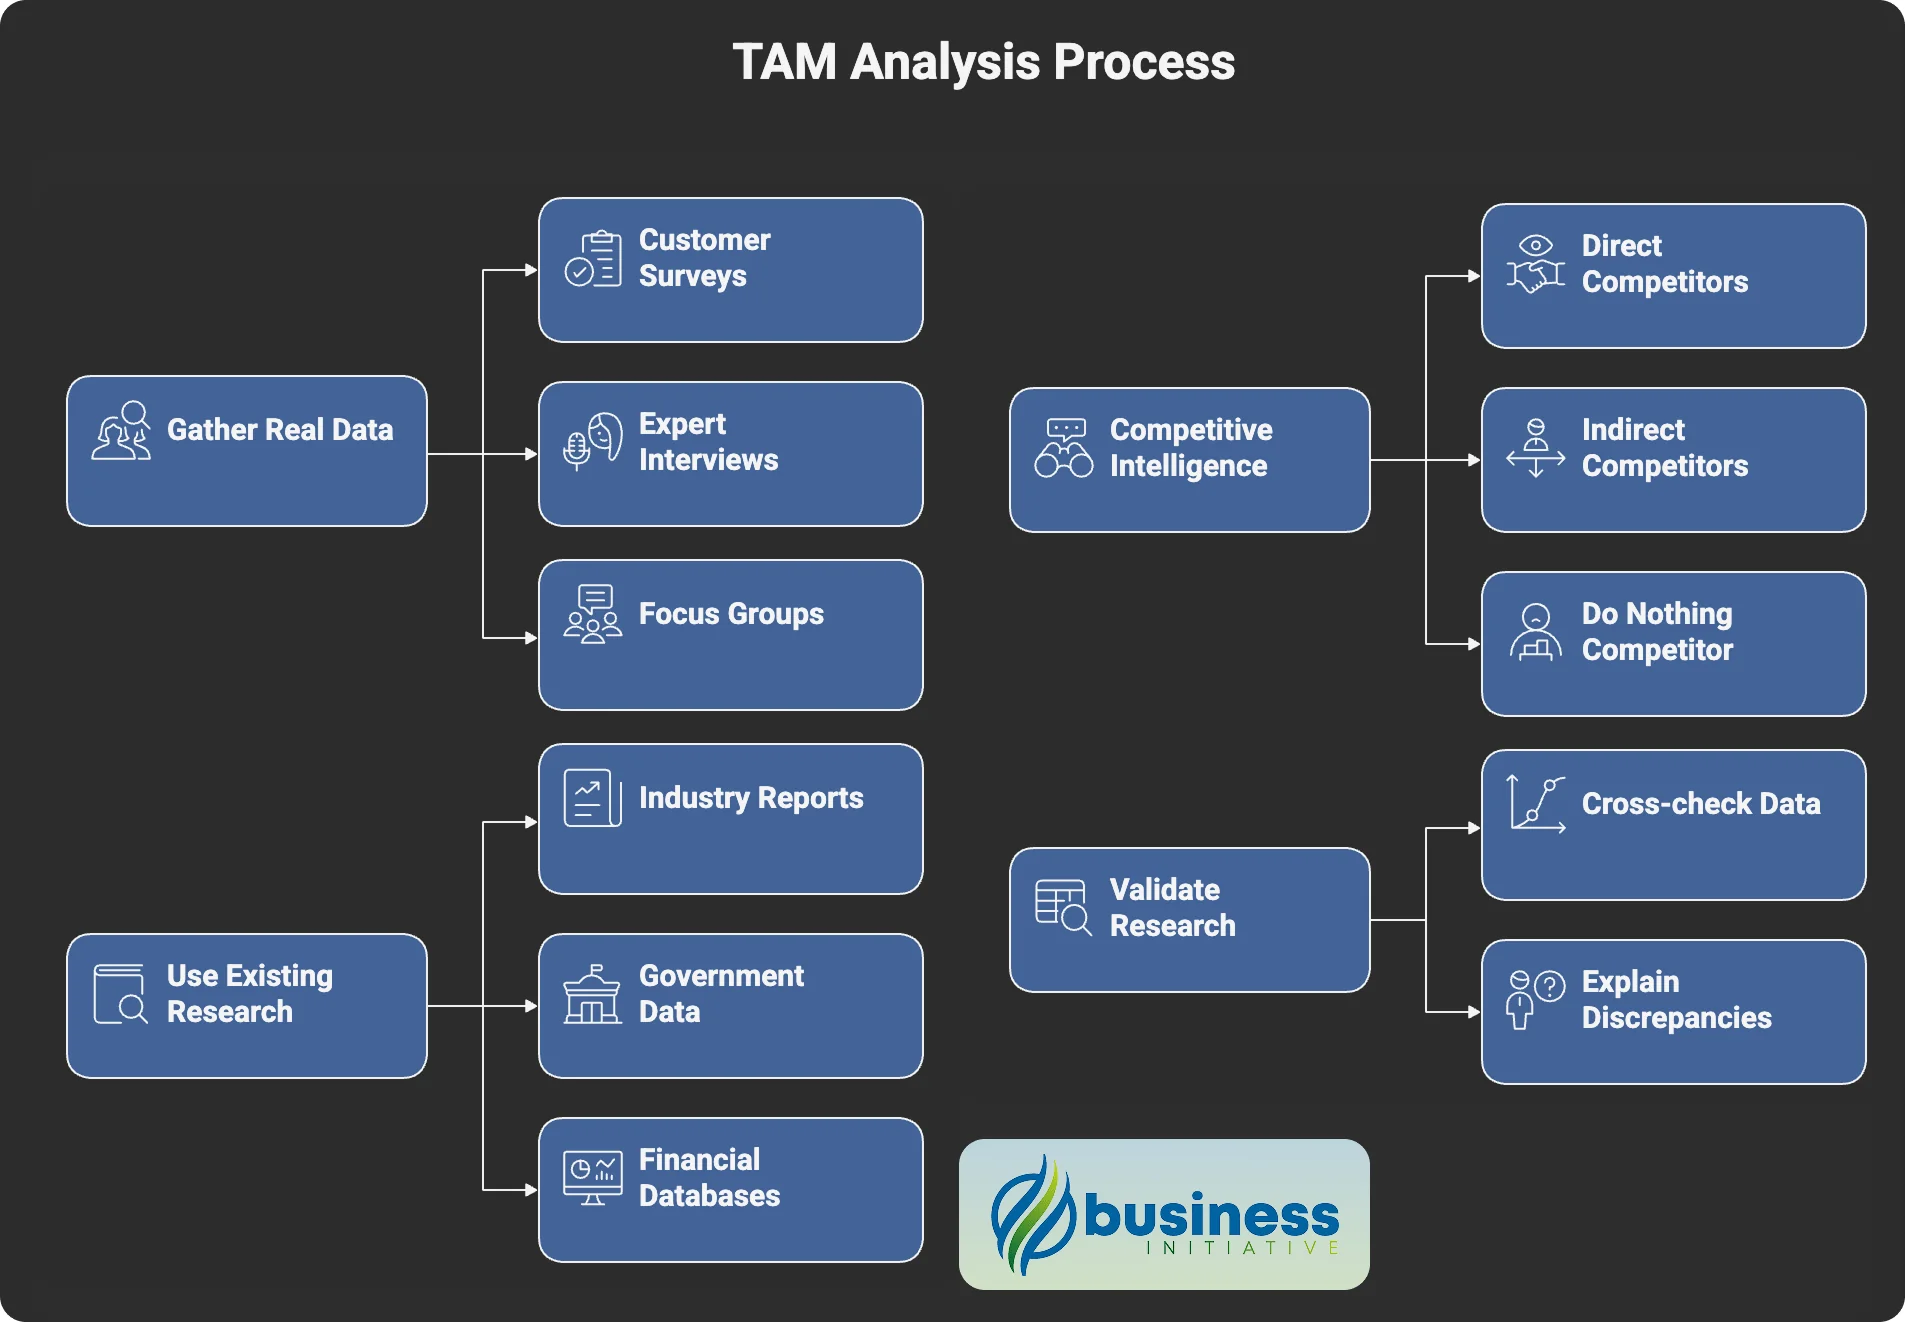
Getting Real Data from Real People
Customer Surveys: Ask about current spending, willingness to pay, and purchase frequency. Use SurveyMonkey or even Google Forms—keep it simple.
Expert Interviews: Talk to industry analysts, potential customers, and current users of competitor products. Ask about budgets, market size, and what drives purchase decisions.
Focus Groups: Test your assumptions about pricing and pain points. Sometimes what you think is a huge problem turns out to be a minor annoyance.
Using Existing Research
Industry Reports: Gartner, IBISWorld, and McKinsey publish market size data. Expensive but credible.
Government Data: U.S. Census Bureau and Bureau of Labor Statistics are goldmines of free demographic and economic data.
Financial Databases: Crunchbase for startup data, SEC filings for public companies, PitchBook for private market intelligence.
Competitive Intelligence
Study both direct competitors (same solution) and indirect ones (different solutions to the same problem). Tools like SimilarWeb and SEMrush help you analyze competitor traffic and strategies.
Pro tip: Don’t forget about the “do nothing” competitor. Sometimes your biggest competition is customers deciding they can live with the status quo.
Validating Your Research
Cross-check everything. Industry reports say one thing, your customer interviews say another? Dig deeper. Test different scenarios. Run sensitivity analyses.
The best TAM analyses combine multiple data sources and explain any discrepancies rather than ignoring them.
Common TAM Mistakes to Avoid
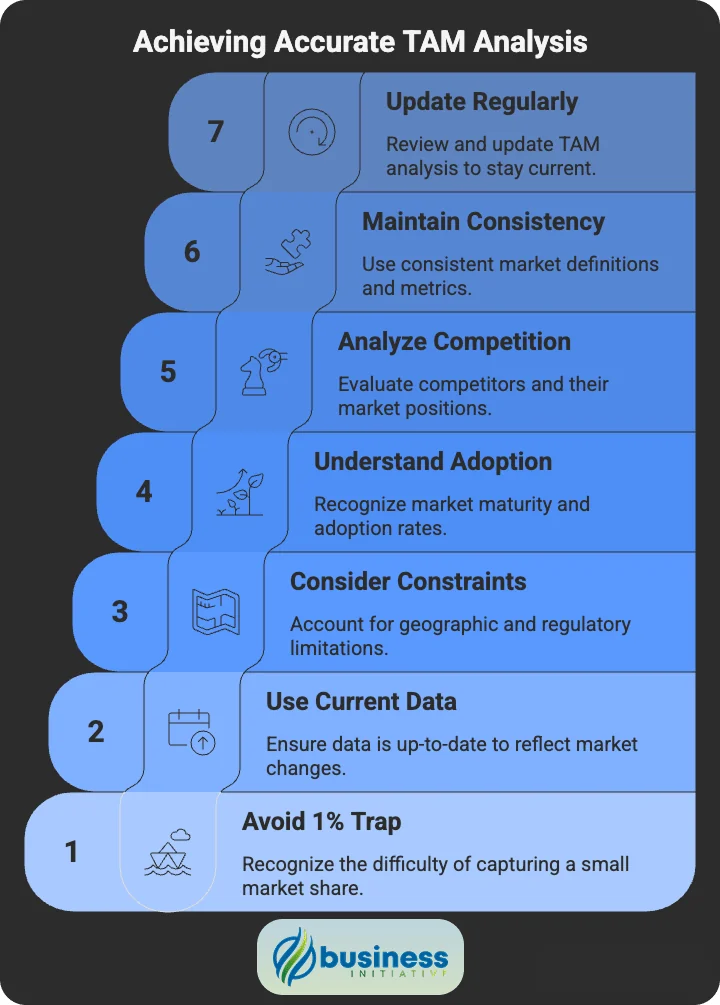
Mistake #1: The “1% of a Huge Market” Trap
I see this in every investor meeting. Some founder puts up a slide that says “The market is $10 billion, so if we just get 1%, that’s $100 million!”
Stop. Just stop.
This tells me you don’t understand your market, your competition, or basic business dynamics. Getting 1% of any large market is incredibly hard. Just ask yourself: name me one company that accidentally stumbled into 1% market share.
Here’s what’s wrong with this thinking:
- You’re confusing TAM (total opportunity) with what you can actually get
- That “just 1%” ignores every competitor, switching cost, and market reality
- It shows investors you haven’t done the hard work of understanding your path to customers
Do this instead: Use the TAM-SAM-SOM framework properly. Say something like: “The CRM market is $69 billion globally (TAM). Our addressable segment—small businesses in North America—is $5 billion (SAM). Based on our go-to-market strategy and competitive positioning, we can realistically capture $50 million (SOM) over five years.”
See the difference? You’re showing you understand the market at multiple levels.
Mistake #2: Living in the Past with Stale Data
I can’t tell you how many TAM analyses I’ve seen that rely on industry reports from 2019. As if nothing has changed since then. As if there wasn’t a global pandemic. As if AI didn’t just revolutionize half the software industry.
Markets move fast. Technology markets move faster. And relying on outdated data is like using a three-year-old GPS to navigate a city that’s been completely rebuilt.
The dead giveaways:
- Citing research from more than two years ago
- Ignoring major disruptions (hello, remote work revolution?)
- Using pre-pandemic behavior patterns for post-pandemic planning
Smart approach: Layer your research. Start with the latest industry reports, but supplement with fresh primary research. Talk to actual customers. Look at what’s happened in the last 12 months, not the last decade.
And please, account for the big shifts. COVID changed customer behavior permanently. AI is reshaping entire industries. Your TAM analysis should reflect the world we’re actually living in, not the one that existed before everything changed.
Mistake #3: Ignoring Geographic and Regulatory Constraints
The Problem: Assuming global market size applies to your specific operating environment.
Why It’s Wrong:
- Regulatory requirements vary by country
- Cultural differences affect product adoption
- Distribution channels differ globally
- Economic conditions vary significantly
The Fix:
- Clearly define your geographic scope
- Research local regulations and compliance requirements
- Consider cultural factors affecting adoption
- Account for economic differences between markets
Example: A fintech startup can’t simply apply the global financial services TAM to their specific market if they’re only licensed to operate in certain states or countries.
Mistake #4: Overlooking Market Maturity and Adoption Rates
The Problem: Assuming immediate full market adoption without considering the technology adoption lifecycle.
Why It’s Wrong:
- New technologies have adoption curves
- Different customer segments adopt at different rates
- Market education takes time and resources
The Fix:
- Consider where your market is in the adoption lifecycle
- Segment customers by adoption willingness (innovators, early adopters, etc.)
- Factor in market education and sales cycle length
Market Maturity Factors:
- How new is the technology or solution?
- Are customers already aware of the problem?
- What’s the typical decision-making process?
- How long are sales cycles?
Mistake #5: Failing to Account for Competition
The Problem: Calculating TAM as if you’re the only solution in the market.
Why It’s Wrong:
- Customers have alternatives (including doing nothing)
- Competition affects pricing and market share
- Market leaders have advantages that are hard to overcome
The Fix:
- Map direct and indirect competitors
- Analyze competitive market share
- Consider switching costs and customer loyalty
- Factor in competitive response to your entry
Competitive Analysis Framework:
- Who are the current market leaders?
- What’s their market share and growth rate?
- What are their strengths and weaknesses?
- How might they respond to your entry?
Mistake #6: Mixing Up Different Market Definitions
The Problem: Combining different market definitions or using inconsistent metrics.
Why It’s Wrong:
- Creates confusion and inaccurate calculations
- Makes it difficult to validate findings
- Leads to incorrect strategic decisions
The Fix:
- Use consistent market definitions throughout analysis
- Clearly define what’s included and excluded
- Be specific about units of measurement
- Document your methodology
Common Inconsistencies:
- Mixing revenue and unit volume metrics
- Including different product categories inconsistently
- Using different time periods for comparison
- Confusing global vs. regional market definitions
Mistake #7: Not Updating TAM Analysis Regularly
The Problem: Using the same TAM calculation for years without updating for market changes.
Why It’s Wrong:
- Markets evolve constantly
- New competitors enter and exit
- Customer needs and behaviors change
- Economic conditions affect market size
The Fix:
- Review TAM analysis quarterly or annually
- Update based on new market data
- Adjust for changes in competitive landscape
- Incorporate learnings from customer feedback
When to Update:
- Major market disruptions
- New competitor entries
- Regulatory changes
- Significant economic shifts
- Product pivot or expansion
Strategic Applications of TAM Analysis
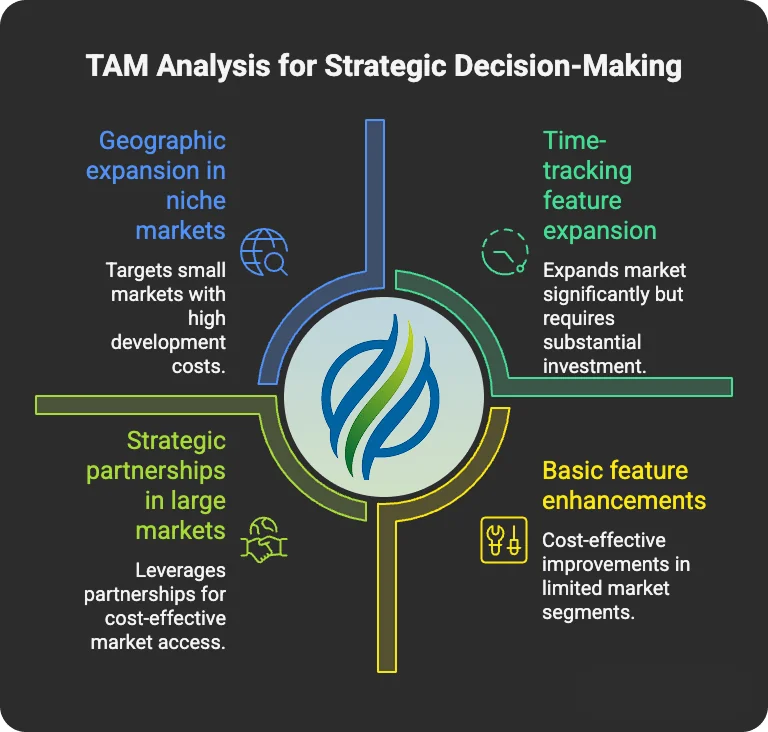
Product Development and Innovation
TAM analysis guides critical product decisions by revealing market opportunities and constraints.
Prioritizing Product Features
Use TAM to evaluate which features to build first:
- Calculate TAM for each potential feature
- Identify features that expand your addressable market
- Prioritize based on market size and development cost
Example: A project management tool discovers that adding time-tracking features would expand their TAM from $2 billion to $5 billion by accessing the broader productivity software market.
Market Expansion Strategy
TAM helps identify the most attractive expansion opportunities:
- Compare TAM across different customer segments
- Evaluate geographic expansion potential
- Assess vertical market opportunities
Innovation Investment
Allocate R&D resources based on market potential:
- High-TAM opportunities justify larger investments
- Use TAM to set innovation budgets
- Validate emerging technology investments
➤ ADVANCED: Explore our Advanced TAM Calculator with Enhanced Features
Fundraising and Investor Relations
Investors use TAM to evaluate the potential return on their investment.
Pitch Deck Essentials
Include TAM analysis in your investor presentations:
- Lead with TAM to establish market opportunity
- Use TAM-SAM-SOM framework for credibility
- Show how TAM supports your valuation
Valuation Justification
TAM helps justify your company’s valuation:
- Larger TAM supports higher valuations
- Show clear path to capture meaningful market share
- Demonstrate understanding of market dynamics
Example Investor Narrative: “We’re addressing a $50 billion TAM in the enterprise software market. Our SAM of $10 billion represents companies with 100-5000 employees who need our solution. We’re targeting 2% market share within 5 years, representing $200 million in revenue.”
Market Entry and Expansion
TAM analysis informs go-to-market strategy and expansion decisions.
Geographic Expansion
Prioritize markets based on TAM analysis:
- Calculate TAM for each potential market
- Consider regulatory and cultural factors
- Evaluate competitive landscape by region
Vertical Market Strategy
Use TAM to select target industries:
- Compare TAM across different verticals
- Assess product-market fit by industry
- Evaluate competitive intensity
Partnership Strategy
TAM helps identify valuable partnerships:
- Partner with companies serving large TAMs
- Evaluate channel partner market reach
- Assess strategic acquisition opportunities
Competitive Strategy
TAM analysis reveals competitive opportunities and threats.
Competitive Positioning
Use TAM to identify market gaps:
- Map competitor coverage of TAM
- Identify underserved market segments
- Find opportunities for differentiation
Pricing Strategy
TAM influences pricing decisions:
- Larger TAM may support premium pricing
- Consider willingness to pay across market segments
- Evaluate price sensitivity by customer size
Defensive Strategy
Protect your market position:
- Monitor competitor TAM expansion
- Identify markets vulnerable to disruption
- Develop defensive product strategies
Resource Allocation
TAM analysis guides investment decisions across your business.
Sales and Marketing
Allocate resources based on market potential:
- Focus sales efforts on highest-TAM segments
- Set marketing budgets proportional to TAM
- Prioritize customer acquisition by segment
Operations and Infrastructure
Scale operations based on TAM:
- Plan infrastructure for market potential
- Build teams for addressable market size
- Invest in customer success capabilities
Strategic Planning
Use TAM for long-term planning:
- Set realistic growth targets
- Plan expansion timelines
- Evaluate strategic initiatives
Performance Measurement
TAM provides context for evaluating business performance.
Market Share Tracking
Monitor your progress against TAM:
- Calculate current market share
- Track share growth over time
- Benchmark against competitors
Growth Potential Assessment
Evaluate future growth opportunities:
- Identify untapped TAM segments
- Assess market penetration rates
- Project growth based on TAM capture
Success Metrics
Define success relative to TAM:
- Set market share targets
- Measure TAM expansion initiatives
- Track competitive position
Tools and Resources for TAM Analysis
➤ ADVANCED: Explore our Advanced TAM Calculator with Enhanced Features
Data Sources
Industry Research: Gartner ($15K-$30K/year), IBISWorld ($995-$3K/report), Statista ($199-$999/month)
Government Data: U.S. Census Bureau, Bureau of Labor Statistics, SEC EDGAR Database (all free)
Financial Data: Crunchbase ($29-$99/month), PitchBook ($25K+/year)
Analysis Tools
Spreadsheets: Excel or Google Sheets (start here) Visualization: Tableau ($70-$170/month), Power BI ($10-$20/month), Google Data Studio (free)
Research Tools
Surveys: SurveyMonkey ($25-$99/month), Typeform ($25-$83/month), Google Forms (free) Interviews: Zoom ($15-$20/month), Calendly ($8-$12/month)
Competitive Intelligence
Website Analysis: SimilarWeb ($199-$799/month), SEMrush ($119-$449/month) Free Options: Google Alerts, Google Trends, LinkedIn Market Research
Budget-Based Toolkits
Startup Budget ($200-$500/month): Statista + SurveyMonkey + SimilarWeb + Google Workspace Professional ($1,000-$2,000/month): IBISWorld + Crunchbase Pro + Tableau + SEMrush Enterprise ($5,000+/month): Gartner + PitchBook + Qualtrics + dedicated research team
Pro tip: Start with free government data and basic survey tools. Upgrade as your needs and budget grow.
Real-World TAM Analysis Case Studies
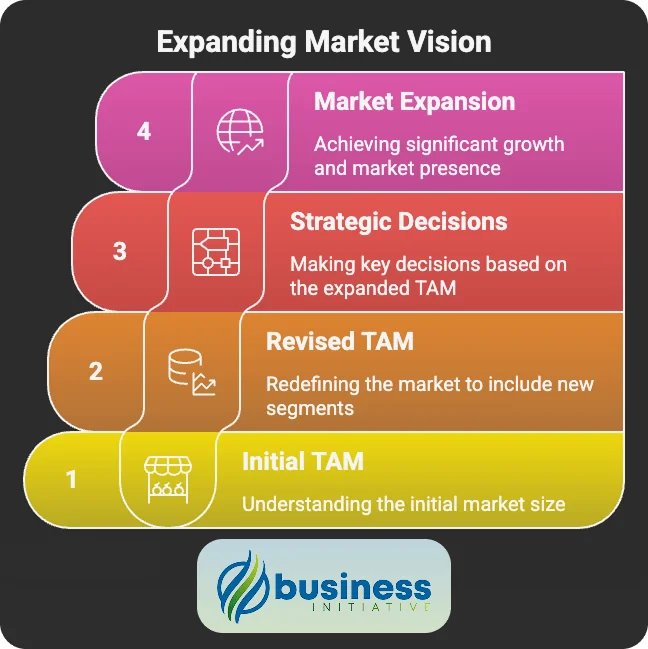
Case Study 1: Airbnb’s Market Expansion
The Challenge: When Airbnb launched in 2008, they needed to convince investors that home-sharing could become a massive market, not just a niche alternative to hotels.
Initial TAM Calculation:
- Traditional Approach: Hotel industry TAM of $100 billion
- Problem: This significantly underestimated the opportunity
Revised TAM Analysis: Airbnb redefined their market to include:
- Traditional hotel stays: $100 billion
- Extended stays and relocations: $200 billion
- Business travel accommodations: $300 billion
- Unique travel experiences: $150 billion
- Total TAM: $750 billion
Methodology Used:
- Top-down: Started with global travel and accommodation spending
- Bottom-up: Analyzed potential host properties and average rates
- Value theory: Calculated value created through cost savings and unique experiences
Results:
- Justified massive investment in global expansion
- Supported $31 billion valuation at IPO
- Demonstrated to investors the platform’s scalability beyond traditional hospitality
Key Learnings:
- Don’t limit TAM to existing market categories
- Consider how your product creates new market opportunities
- Use TAM to justify bold expansion strategies
Case Study 2: Slack’s B2B Communication Revolution
The Challenge: Slack needed to demonstrate that workplace communication was a large enough market to justify their growth strategy and valuation.
TAM Calculation Approach:
- Traditional Method: Email and messaging software market ($3 billion)
- Expanded Vision: Entire business communication and collaboration market
Comprehensive TAM Analysis:
- Email productivity tools: $3 billion
- Video conferencing solutions: $8 billion
- Project management platforms: $5 billion
- Document collaboration tools: $4 billion
- Internal communication systems: $2 billion
- Total TAM: $22 billion
Bottom-Up Validation:
- Global knowledge workers: 1.3 billion
- Target segment (office workers): 350 million
- Average willingness to pay: $100 per user annually
- Calculated TAM: $35 billion
Strategic Applications:
- Guided product development roadmap
- Justified $27 billion Salesforce acquisition
- Supported expansion into enterprise market
- Informed international expansion strategy
Results:
- Achieved $1 billion ARR within 10 years
- Captured significant market share in business communication
- Expanded TAM through platform integrations
Key Learnings:
- Multiple calculation methods provide validation
- TAM can justify premium valuations
- Regular TAM updates guide strategic pivots
Case Study 3: Tesla’s Electric Vehicle Market
The Challenge: Tesla needed to convince investors that electric vehicles could become mainstream, not just a luxury niche.
Initial Market Skepticism:
- Traditional auto industry viewed EVs as limited market
- Luxury EV segment TAM: $5 billion
- Range anxiety and charging infrastructure concerns
Tesla’s Expanded TAM Vision:
- Global automotive market: $3 trillion
- Energy storage systems: $120 billion
- Solar energy solutions: $180 billion
- Autonomous vehicle services: $7 trillion
- Total TAM: $10+ trillion
Calculation Methodology:
- Top-down: Global transportation spending analysis
- Bottom-up: Vehicle units × average selling price by segment
- Value theory: Cost savings from fuel efficiency and maintenance
Market Segmentation:
- Luxury EVs: $50 billion (initial focus)
- Premium EVs: $200 billion (Model S/X expansion)
- Mass market EVs: $800 billion (Model 3/Y strategy)
- Commercial EVs: $500 billion (Cybertruck/Semi)
Strategic Decisions Based on TAM:
- Prioritized mass market Model 3 development
- Invested in charging infrastructure (Supercharger network)
- Expanded into energy storage and solar
- Developed autonomous driving capabilities
Results:
- Became world’s most valuable automaker
- Achieved $1 trillion market capitalization
- Accelerated global EV adoption
- Expanded beyond automotive into energy ecosystem
Key Learnings:
- TAM can support contrarian investment strategies
- Long-term TAM vision justifies short-term losses
- Platform thinking expands addressable market
Case Study 4: Zoom’s Video Conferencing Revolution
The Challenge: Zoom entered a crowded market against Skype and WebEx.
TAM Expansion: From $4B (business conferencing) to $100B+ by including remote work, virtual events, telehealth, and online education.
Key Strategy: Focused on ease of use rather than enterprise features, invested in scalable infrastructure.
Results: Grew from 10M to 300M users in 2020, 326% revenue growth.
Learning: External events (pandemic) can dramatically expand TAM. User experience unlocks new segments.
Case Study 5: Shopify’s E-commerce Platform
The Challenge: Competing against Amazon required finding a differentiated position.
TAM Evolution: From $2B (e-commerce platforms) to $500-750B by targeting global e-commerce sales rather than just platform tools.
Key Strategy: Served underserved SMB market, expanded from simple stores to complete commerce ecosystem with payments, fulfillment, and enterprise solutions.
Results: $5B+ ARR, powers 1.7M+ businesses across 175 countries.
Learning: Serving underserved segments creates massive opportunities. Platform expansion multiplies TAM.
FAQs - Frequently Asked Questions About Total Addressable Market

What is Total Addressable Market (TAM)?
TAM is the total revenue opportunity available if you captured 100% of your market.
It represents the theoretical maximum revenue your business could generate.
Learn More...
Total Addressable Market (TAM) represents the total revenue opportunity available for a product or service if 100% market share was achieved.
It's the theoretical maximum revenue your business could generate if every potential customer in your market bought your product.
TAM answers the fundamental question: 'What's the size of the prize?' and helps businesses understand the full scope of their market opportunity.
Why is TAM analysis important for my business?
TAM guides strategic decisions and resource allocation.
It helps secure funding and validates market opportunities.
Learn More...
TAM analysis is crucial for strategic decision-making, helping you evaluate whether a market opportunity is worth pursuing.
It guides resource allocation by showing where to focus your limited resources - product development, marketing spend, or sales efforts.
For investors, TAM demonstrates market opportunity and validates your business model, often leading to better fundraising outcomes.
Companies with accurate TAM analysis raise 40% more funding on average and are 3x more likely to achieve product-market fit within 18 months.
What are the three main methods for calculating TAM?
Top-down: Uses industry reports and narrows to your segment.
Bottom-up: Builds from specific customer data and pricing.
Value theory: Estimates based on value created for customers.
Learn More...
The top-down approach starts with broad market data from industry reports and narrows down to your specific segment.
The bottom-up approach builds TAM from specific customer data by counting potential customers and multiplying by average revenue per customer.
The value theory approach estimates TAM based on the value your product creates for customers and your capture rate of that value.
Using multiple methods provides validation and creates a more credible TAM analysis.
What's the difference between TAM, SAM, and SOM?
TAM is total market opportunity, SAM is your serviceable portion, SOM is what you can realistically capture.
They represent decreasing levels of market opportunity.
Learn More...
TAM (Total Addressable Market) is the total market demand for your product or service globally.
SAM (Serviceable Addressable Market) is the portion of TAM that your business can realistically target with your current business model and resources.
SOM (Serviceable Obtainable Market) is the portion of SAM that you can realistically capture, considering competition and market dynamics.
This framework helps set realistic expectations: TAM for vision, SAM for strategy, and SOM for planning.
How often should I update my TAM analysis?
Review TAM quarterly or annually.
Update when major market changes occur.
Learn More...
TAM analysis should be reviewed quarterly or annually as markets evolve constantly.
Major updates are needed when there are significant market disruptions, new competitor entries, regulatory changes, or economic shifts.
Regular updates ensure your strategic decisions remain based on current market realities.
67% of high-growth companies regularly update their TAM analysis to maintain competitive advantage.
What are common mistakes in TAM calculation?
Confusing TAM with revenue projections.
Using outdated data or ignoring competition.
Learn More...
Common mistakes include confusing TAM with revenue projections and assuming unrealistic market share.
Using outdated or irrelevant data that doesn't reflect current market conditions is another major error.
Ignoring geographic and regulatory constraints, failing to account for competition, and mixing different market definitions also lead to inaccurate TAM calculations.
The key is using consistent definitions, multiple calculation methods, and regularly updating your analysis.
How can I validate my TAM calculations?
Use multiple calculation methods for cross-validation.
Conduct primary research with potential customers.
Learn More...
Validate TAM calculations by using multiple methods (top-down, bottom-up, value theory) and comparing results.
Conduct primary research through customer surveys, expert interviews, and focus groups to validate assumptions.
Cross-reference multiple data sources and perform sensitivity analysis to test different scenarios.
Seek feedback from industry experts, investors, and advisors who understand your market.
What data sources should I use for TAM research?
Industry reports from Gartner, IBISWorld, and Statista.
Government data, financial databases, and primary research.
Learn More...
Reliable data sources include industry research platforms like Gartner, IBISWorld, and Statista for market size data.
Government sources such as the U.S. Census Bureau and Bureau of Labor Statistics provide demographic and economic data.
Financial databases like Crunchbase and SEC filings offer company-specific information.
Primary research through surveys, interviews, and competitive analysis provides the most relevant and current data for your specific market.
How do I present TAM analysis to investors?
Use the TAM-SAM-SOM framework for credibility.
Show clear methodology and multiple validation methods.
Learn More...
Present TAM analysis using the TAM-SAM-SOM framework to demonstrate both market opportunity and realistic expectations.
Clearly explain your methodology and show how you validated your calculations using multiple approaches.
Use credible data sources and provide context about market growth trends and competitive dynamics.
Connect your TAM analysis to your business strategy, showing how market size justifies your funding request and growth plans.
Can TAM analysis help with product development decisions?
Yes, TAM guides feature prioritization and market expansion.
It helps identify the most valuable product opportunities.
Learn More...
TAM analysis guides product development by helping prioritize features based on market potential.
It identifies which features could expand your addressable market and justify development investment.
TAM analysis helps evaluate market expansion opportunities, such as new customer segments or geographic markets.
By understanding the size of different market opportunities, you can allocate R&D resources to the highest-impact initiatives.
The Bottom Line
Here’s what I want you to remember from all this: TAM isn’t just some number you calculate once for your pitch deck and then forget about. It’s your strategic compass.
Every major decision you make should connect back to your understanding of market opportunity. That new feature you’re considering? How does it expand your TAM? That expensive sales hire? Does your SOM justify their quota? The partnership you’re evaluating? Will it help you capture more of your SAM?
This is what separates the entrepreneurs who build lifestyle businesses from the ones who build empires. The empire builders understand their market opportunity inside and out. They know not just what they’re building, but how big the opportunity really is.
When you nail your TAM analysis, everything else becomes clearer:
- Product decisions become obvious (focus on what expands the addressable market)
- Resource allocation becomes strategic (invest where the opportunity is largest)
- Investor conversations become compelling (you’re not just pitching a product, you’re pitching an opportunity)
- Growth planning becomes realistic (you know what’s actually achievable)
What You Need to Do Right Now
Stop reading and start calculating. Seriously. The best TAM analysis in the world is worthless if you never act on it.
Here’s your homework:
This week: Calculate your TAM using all three methods. Don’t worry about perfection—worry about getting started. Use industry reports for top-down, count your potential customers for bottom-up, and estimate the value you create for value theory.
This month: Talk to 10 potential customers. Validate your assumptions about market size, willingness to pay, and competitive landscape. You’ll be surprised how wrong some of your assumptions are.
This quarter: Build TAM analysis into your regular planning process. Make it part of how you evaluate new opportunities, allocate resources, and measure progress.
Remember: Uber didn’t become a $100 billion company by staying in the taxi business. Airbnb didn’t build an empire by only thinking about the hotel market. Tesla didn’t revolutionize transportation by accepting the existing auto market as fixed.
They all understood something fundamental: the biggest opportunities come from redefining your market, not just serving it.
Your Market Opportunity Is Waiting
The entrepreneurs who win aren’t the smartest or the best funded. They’re the ones who understand their market opportunity better than anyone else and act on that understanding.
You now have the tools. You know the methods. You understand the frameworks.
The only question left is: what are you going to do with this knowledge?
Your competition is out there making decisions based on gut feel and outdated assumptions. You can make decisions based on data and strategic thinking. That’s your unfair advantage.
Ready to size your market like a pro?
Let’s talk about your specific situation. I’ll help you calculate your TAM, identify the biggest opportunities, and create a strategic plan that actually makes sense.
Have questions about your market?
Drop me a line. I love talking about market opportunities and helping entrepreneurs think bigger.
Want more insights like this?
Subscribe to the newsletter. I share the frameworks and strategies that actually work—no fluff, just actionable insights you can use to grow your business.
Remember: Every day you delay understanding your market is a day your competitors gain ground.
The tools, techniques, and insights in this guide give you everything you need to master TAM analysis.
The only question left is: What are you waiting for?
Sources & Additional Information
Here are all of the sources used to write this article:
- CB Insights: The Top 12 Reasons Startups Fail
- Gartner Magic Quadrant Research Methodology
- IBISWorld Industry Research Methodology
- U.S. Census Bureau Economic Census
- SEC EDGAR Database
- Crunchbase Data Methodology
- PitchBook Data Methodology
- Statista Research Methodology
- SimilarWeb Traffic Analysis Methodology
- SEMrush Keyword Research Guide
Here are some additional resources that can be useful for learning more about TAM analysis:
- Business Initiative: Market Opportunity Finder
- Business Initiative: Top Industries for Growth
- Business Initiative: Market Segmentation Analyzer
- Business Initiative: Tools
Our resources will help you deepen your understanding of TAM analysis and apply advanced market sizing techniques to your business.
