Unlock the secrets to successful nonprofit fundraising with our latest article exploring current fundraising trends and best practices for nonprofit fundraising in 2025.
We dive deep into the 2025 Benchmarks Study, a comprehensive fundraising study packed with original insights and fundraising statistics.
This isn’t just another report—it’s a guide crafted with expertise and dedication, designed to help you navigate the complex world of fundraising.
Discover how to leverage these findings to solve real-world challenges and boost your organization’s impact.
 Key Takeaways
- Monthly giving is growing fast: Prioritize recurring donations, as monthly gifts now make up 31% of online revenue and are rising steadily.
- Optimize digital donation pages: Simplifying forms and preselecting monthly options can significantly boost donor conversion rates and overall revenue.
- Peer-to-peer fundraising works: Encourage supporters to fundraise for you, especially in sectors like Health, to attract new donors and increase engagement.
- Sector-specific strategies matter: Tailor your approach—what works for Public Media or Hunger/Poverty may not work for Disaster Aid or Animal Welfare.
- Integrate online and offline channels: Combining digital, direct mail, and DAFs maximizes reach and revenue across diverse donor segments.
Our article is structured for clarity and ease of use.
We break down complex data into actionable strategies, providing you with tools and features to enhance your fundraising efforts.
Whether you’re a nonprofit professional or a business owner looking to align with these trends, you’ll find valuable takeaways here.
 Table of Contents
- The Big Picture: Fundraising Landscape in 2024
- Harnessing the Power of Monthly Giving
- Understanding Donor Behavior
- Sector-Specific Opportunities
- Boosting Digital Impact: Donation Pages and Websites
- Beyond Digital: Direct Mail and DAFs
- For Business Owners: Partnering with Nonprofits
- FAQs about Small Business SEO
- Conclusion
Ready to transform your approach and achieve greater success?
Dive in and explore the unique perspectives and solutions we’ve gathered just for you.
Keep reading to unlock the full potential of your fundraising strategy.
The Big Picture: Fundraising Landscape in 2024
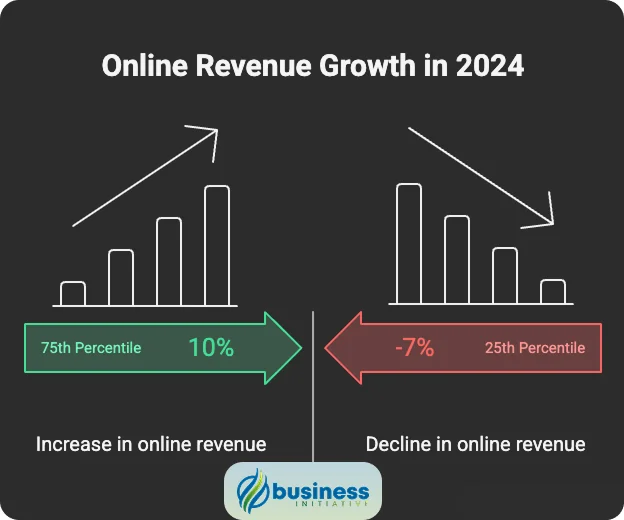
The nonprofit sector saw a 2% increase in online revenue in 2024, reflecting positive 2024 giving trends and signaling steady growth for the average organization.
However, performance varied widely:
- Nonprofits at the 25th percentile experienced a 7% decline.
- Those at the 75th percentile enjoyed a 10% increase.
- As the study notes: “This average figure represents the median—the halfway point with participants as likely to fall below this level as they are to rise above it.”
This variability underscores the potential for nonprofits to rise above the median with strategic adjustments and effective fundraising strategies 2025.
Notably:
- One-time giving remained flat year-over-year.
- Monthly giving surged by 5%, comprising 31% of online revenue.
- Restricted giving held steady at 4%, consistent with the 4-5% range from 2020-2024.
Initiative Insight:
Embrace the upward trend in monthly giving and use data to identify where your organization falls in the performance spectrum—then aim for the top quartile.
Harnessing the Power of Monthly Giving
Monthly giving is emerging as a cornerstone of sustainable fundraising:
- Revenue from monthly gifts grew by 5%, outpacing stagnant one-time giving.
- The average monthly gift was $24, compared to $126 for one-time gifts.
- A monthly gift needs to repeat 5.25 times to match a one-time gift’s value, though in sectors like Wildlife/Animal Welfare, it’s just 3.38 times (with one-time gifts at $61).
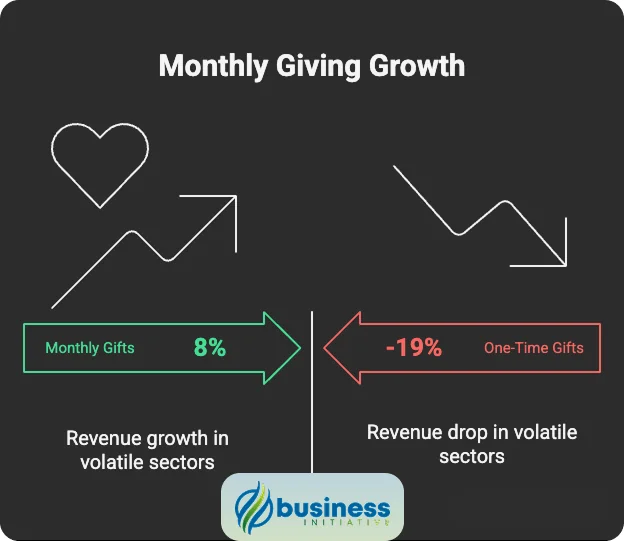
This reliability shines in volatile sectors like Disaster/International Aid, where monthly revenue rose 8% despite a 19% drop in one-time giving.
Yet, challenges remain: the average donor conversion rate on donation pages is only 12%.
As the study advises: “Addressing that challenge is one of the most impactful ways that nonprofits can increase online revenue across channels.”
Initiative Insight:
Promote recurring donations by showcasing their long-term impact. Test campaigns that make monthly giving the default ask to capitalize on this growing trend.
Understanding Donor Behavior
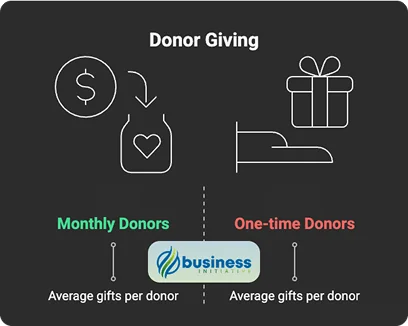
Donors are the heartbeat of fundraising success, and their behavior offers critical clues:
- One-time donors gave 1.3 times on average, contributing $179 total per donor.
- Monthly donors added 0.2 extra one-time gifts, averaging $18 each.
- New donors accounted for 21% of online donors, with no prior online giving history.
The Health sector stands out, with 44% of revenue from new donors, driven by peer-to-peer fundraising and innovative fundraising strategies 2025.
The study highlights: “Health nonprofits have long found success in peer-to-peer fundraising, with committed supporters asking friends and loved ones to support walk-a-thons and other collective fundraising efforts.”
Initiative Insight:
Invest in retaining existing donors while tapping into peer-to-peer strategies to attract newcomers. Small, consistent engagement efforts can turn one-time givers into loyal supporters.
Sector-Specific Opportunities
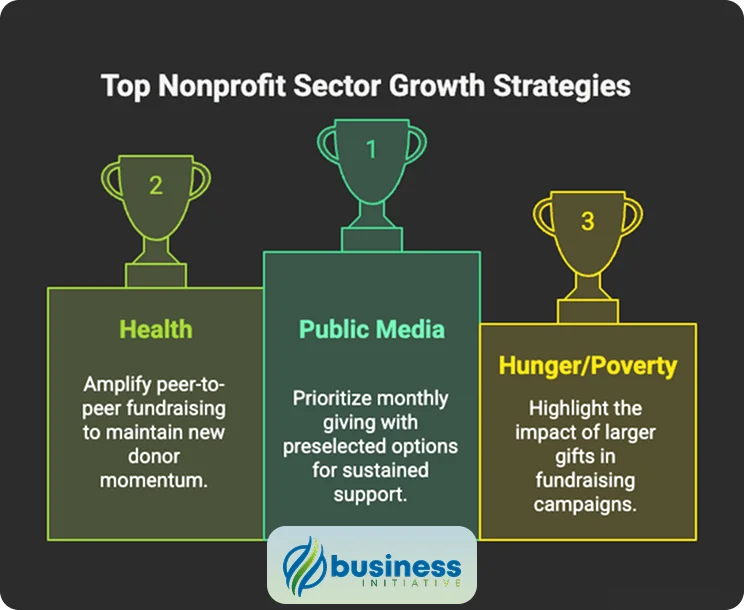
The study reveals distinct trends across nonprofit sectors, offering tailored paths to growth:
Disaster/International Aid
- Average online revenue fell by 13%, with top performers still seeing a 6% decline.
- Monthly revenue grew by 8%, offsetting a 19% drop in one-time giving.
- Restricted giving dropped to 6% (from 16% in 2023 and 26% in 2022).
- Insight: “This sector often shows the greatest volatility from year to year… donors respond to acute, high-profile humanitarian crises, and that support often fades over time.”
- Action: Build a robust monthly giving base to weather unpredictable cycles.
Rights
- Median revenue dipped by 2%, but the 75th percentile saw 21% growth.
- Insight: “It’s possible that the presidential election… sparked a surge in support for Rights nonprofits,” reflecting broader charitable giving changes.
- Action: Seize timely events to rally donor enthusiasm.
Public Media
- 61% of online revenue came from monthly giving.
- 86% of donation pages preselected monthly options.
- Insight: “Public Media, a sector with a long history of prioritizing membership and sustaining giving, was the only sector that was more likely to prioritize a monthly giving ask.”
- Action: Emulate this focus on “sustaining giving” with preselected monthly defaults.
Health
- 44% of revenue from new donors.
- Action: Amplify peer-to-peer fundraising to sustain this momentum.
Hunger/Poverty
- Highest gift sizes: $46 monthly, $177 one-time.
- Highest revenue per website visitor: $8.15.
- Action: Highlight the power of larger gifts in messaging.
Wildlife/Animal Welfare
- Lowest one-time gift: $61; monthly at $18.
- Action: Encourage frequent, smaller monthly contributions.
Boosting Digital Impact: Donation Pages and Websites
Digital fundraising trends 2025 show that digital channels are ripe for optimization:
- Donation page completion rate: 12%—a clear chance to convert more visitors.
- Preselected options: 62% of nonprofits favor one-time giving, but 86% of Public Media opts for monthly.
- Website conversion: 0.16% of visitors donate, yielding $1.29 per visitor on average.
Initiative Insight:
Simplify donation forms, test preselecting monthly giving, and enhance website UX to turn visitors into donors.
Sectors like Hunger/Poverty show what’s possible with higher yields.
Beyond Digital: Direct Mail and DAFs
Beyond digital approaches, traditional channels complement online efforts with strong fundraising benchmarks:
- Direct mail raised $0.78 per dollar of online revenue, up 3% in 2024, demonstrating strong direct mail fundraising benchmarks.
- DAF revenue increased by 6%.
Initiative Insight:
Integrate direct mail and DAFs into your strategy to reach diverse donor segments and maximize returns.
For Business Owners: Partnering with Nonprofits
Business owners can draw inspiration from these fundraising industry trends 2025:
- Support monthly giving programs to align with sustainable giving trends.
- Sponsor peer-to-peer events in high-performing sectors like Health.
- Partner with nonprofits in resilient sectors (e.g., Hunger/Poverty) for impactful CSR initiatives.
Benefit:
Strengthen your brand while fueling nonprofit success—a win-win rooted in data.
FAQs - Frequently Asked Questions About Nonprofit Fundraising Trends

What is the current trend in monthly giving for nonprofits in 2025?
Monthly giving increased by 5% in 2024, now making up 31% of online revenue for nonprofits.
Learn More...
The landscape of nonprofit giving is shifting significantly towards monthly donations.
Monthly gifts average $24 compared to $126 for one-time gifts.
Monthly giving has proven particularly valuable in volatile sectors like Disaster/International Aid, where it grew 8% despite a 19% drop in one-time giving.
- Monthly donors tend to give 0.2 extra one-time gifts averaging $18 each
- Public Media leads with 61% of online revenue from monthly giving
- Monthly gifts need to repeat 5.25 times to match one-time gift value
- 86% of Public Media organizations preselect monthly options on donation pages
This trend indicates a shift towards more sustainable and predictable revenue streams for nonprofits.
How much do average donors give to nonprofits in 2025?
One-time donors give an average of $126 per gift, while monthly donors contribute $24 per month.
Learn More...
Donor giving patterns vary significantly across different nonprofit sectors and giving methods.
One-time donors typically give 1.3 times annually, contributing $179 total per donor.
The Hunger/Poverty sector sees the highest gift sizes:
- Monthly gifts average $46
- One-time gifts average $177
- Wildlife/Animal Welfare sees lowest one-time gifts at $61
- New donors make up 21% of online donors
The Health sector stands out with 44% of revenue coming from new donors, largely due to peer-to-peer fundraising success.
Monthly donors often supplement their regular gifts with additional one-time donations, showing higher engagement levels.
What are the most effective strategies for increasing nonprofit donation page conversion rates?
Simplify donation forms and consider preselecting monthly giving options, as current average completion rates are only 12%.
Learn More...
Donation page optimization is crucial for nonprofit success in the digital age.
Current statistics show significant room for improvement:
- Average donation page completion rate: 12%
- Website visitor conversion rate: 0.16%
- Average revenue per website visitor: $1.29
- Top performers (Hunger/Poverty sector) achieve $8.15 per visitor
Key optimization strategies include:
- Simplifying the donation form process
- Testing monthly giving as the default option
- Implementing clear call-to-action buttons
- Optimizing for mobile devices
- Including compelling impact statements
Public Media organizations show the power of preselecting monthly options, with 86% using this strategy successfully.
Integration with multiple payment methods and clear security indicators can boost donor confidence.
How did different nonprofit sectors perform in online fundraising for 2024-2025?
Performance varied widely, with a 2% overall increase in online revenue but significant differences between sectors.
Learn More...
The nonprofit sector showed diverse performance metrics across different categories:
Disaster/International Aid:
- 13% decline in average online revenue
- 8% growth in monthly revenue
- 19% drop in one-time giving
- Restricted giving fell to 6% from 16%
Rights Organizations:
- 2% median revenue decline
- Top performers saw 21% growth
- Strong correlation with political events
Public Media:
- 61% of revenue from monthly giving
- Highest monthly giving focus
- 86% preselection rate for monthly options
Health Sector:
- 44% revenue from new donors
- Strong peer-to-peer fundraising success
These variations highlight the importance of sector-specific strategies and the need for customized approaches to fundraising.
What role does direct mail play in modern nonprofit fundraising?
Direct mail remains significant, raising $0.78 per dollar of online revenue and showing a 3% increase in 2024.
Learn More...
Despite digital transformation, direct mail continues to be a crucial fundraising channel.
The effectiveness of direct mail is enhanced when integrated with digital strategies:
- 3% growth in direct mail effectiveness
- Complements online giving strategies
- Reaches different donor demographics
- Provides tangible connection with donors
Combined with DAF revenue increase of 6%, traditional channels show continued strength.
Success factors for direct mail campaigns include:
- Integration with digital campaigns
- Personalized messaging
- Clear call-to-action
- Multi-channel donor engagement
Organizations achieving the best results typically maintain a balanced approach between digital and traditional fundraising methods.
In Sumamry…
The 2025 Benchmarks Study provides a comprehensive roadmap for nonprofits and business owners alike, highlighting the transformative potential of monthly giving and digital optimization within the evolving fundraising landscape.
By leveraging these insights, nonprofits can enhance donor retention, implement sector-specific strategies, and innovate across multiple channels to significantly boost their impact.
For business owners, the study offers a strategic framework for collaboration with nonprofits, emphasizing the benefits of supporting monthly giving programs, sponsoring peer-to-peer events, and engaging in corporate philanthropy trends 2025 initiatives within resilient sectors like Hunger/Poverty.
By aligning with these trends, businesses can not only strengthen their brand but also contribute to meaningful social change.
The practical application of this information is clear: nonprofits and businesses that adopt these strategies can expect increased engagement, higher conversion rates, and a more sustainable impact.
The data underscores the vast opportunities available for those prepared to take action.
To explore how these insights can be tailored to your organization, we invite you to schedule a consultation call with Business Initiative team or reach out via our contact form.
Stay informed and inspired by subscribing to our Initiative Newsletter and follow us on X for the latest updates and strategies in nonprofit growth and collaboration.
