Understanding your monthly burn rate is arguably the most critical metric for startup financial management and business sustainability, making burn rate calculation essential for every entrepreneur. Your burn rate represents the speed at which your company consumes cash each month, directly impacting your runway and ability to achieve profitability before running out of funds. This monthly cash burn rate is crucial for startup burn rate management.
 Key Takeaways
- Monthly burn rate is the most critical metric for startup financial management and business sustainability.
- Burn rate directly impacts your runway and ability to achieve profitability before running out of funds.
- Tracking burn rate provides essential insights for strategic decision-making and investor communications.
- Our calculator provides benchmarking insights and strategic recommendations for cash optimization.
- Understanding burn rate helps extend operational runway for sustainable growth.
Whether you’re a pre-revenue startup burning through seed funding, a growth-stage company balancing expansion with efficiency, or an established business monitoring cash flow during market uncertainty, tracking your burn rate provides essential insights for strategic decision-making and investor communications.
Our comprehensive calculator not only computes your monthly burn rate but also provides benchmarking insights and strategic recommendations to help you optimize cash consumption and extend your operational runway for sustainable growth. This startup burn rate calculator helps you calculate burn rate rate for saas companies and other business models.
 Table of Contents
Quick Reference: Burn Rate Benchmarks for Startup Burn Rate Management
| Business Stage | Typical Burn Rate | Runway Target | Action Priority |
|---|---|---|---|
| Pre-Revenue Startup | $10K - $50K/month | 12-18 months | Focus on MVP and validation |
| Early Stage (Post-Revenue) | $25K - $100K/month | 18-24 months | Optimize for growth efficiency |
| Growth Stage | $100K - $500K/month | 12-18 months | Balance growth and profitability |
| Mature Company | Varies widely | 6-12 months buffer | Focus on operational efficiency |
Understanding Burn Rate
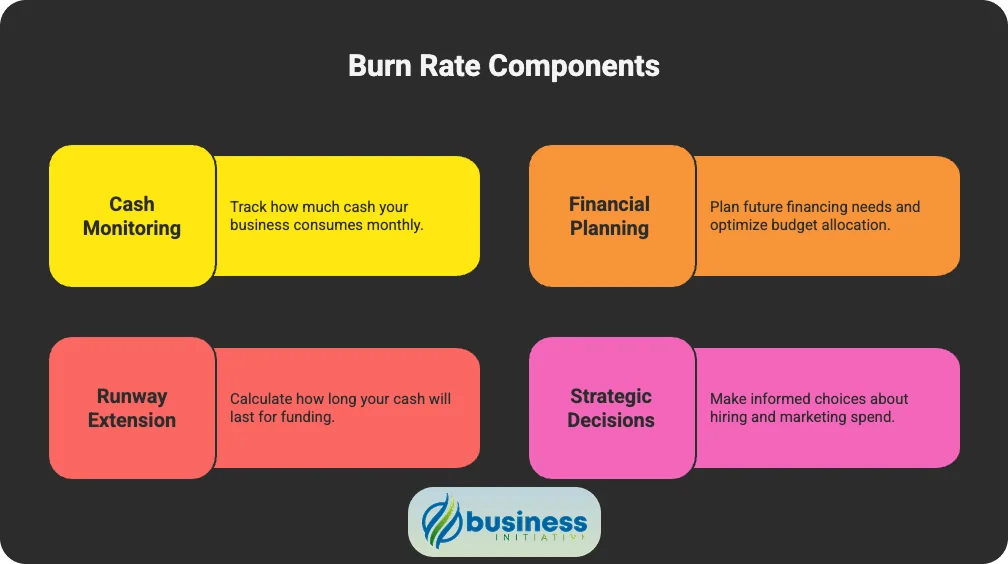
Your burn rate calculation involves understanding the relationship between, which is essential for calculating cash burn rate:
- Monthly Expenses: All operational costs including salaries, rent, marketing, software, and overhead
- Monthly Revenue: Income generated from sales, services, subscriptions, or other business activities
- Net Burn: The difference between expenses and revenue (positive burn means you’re losing money)
How to Use This Calculator
Quick Start Guide for Monthly Burn Rate Calculation
Calculate Monthly Expenses
Add up all fixed and variable costs: payroll, rent, utilities, software, marketing, etc. This is the first step in how to calculate monthly burn rate.
Determine Monthly Revenue
Include all revenue streams: sales, subscriptions, services, and other income
Calculate Net Burn Rate
Get your monthly cash consumption (expenses minus revenue) using the monthly burn rate formula
Analyze and Optimize
Review results against benchmarks and identify improvement opportunities
Monthly Burn Rate Calculator
Interpreting Your Results
Understanding your burn rate results is crucial for making informed business decisions:
Burn Rate Analysis
Positive Burn Rate (Expenses > Revenue)
- Indicates your business is consuming more cash than it generates
- Normal for early-stage startups and growing companies
- Focus on runway management and path to profitability
Negative Burn Rate (Revenue > Expenses)
- Congratulations! Your business is profitable
- Consider reinvestment opportunities for growth
- Maintain cash reserves for unexpected challenges
Break-Even (Revenue = Expenses)
- Your business is cash flow neutral
- Ideal state for sustainable operations
- Balance growth investments with financial stability
Key Metrics to Track
- Gross Burn Rate: Total monthly expenses regardless of revenue
- Net Burn Rate: Monthly expenses minus monthly revenue
- Runway: Months of operation remaining at current burn rate
- Burn Multiple: Burn rate divided by net new revenue (for growing companies)
Cash Flow Optimization Strategies
Reducing Burn Rate
1. Expense Optimization
- Audit recurring subscriptions and eliminate unused services
- Negotiate better rates with vendors and service providers
- Consider remote work to reduce office space costs
- Implement zero-based budgeting for all departments
2. Revenue Acceleration
- Focus on high-margin revenue streams
- Implement upselling and cross-selling strategies
- Improve sales conversion rates and cycle times
- Consider subscription or recurring revenue models
3. Operational Efficiency
- Automate repetitive processes to reduce labor costs
- Outsource non-core functions to reduce fixed costs
- Implement performance-based compensation structures
- Use data analytics to identify cost-saving opportunities
Strategic Burn Rate Management
Growth Stage Considerations:
- Maintain 12-18 months of runway at all times
- Balance growth investments with burn rate control
- Track unit economics and customer acquisition costs
- Plan fundraising 6-9 months before runway depletion
Market Downturn Strategies:
- Extend runway by reducing non-essential spending
- Focus on profitable customer segments
- Preserve cash for strategic opportunities
- Maintain flexibility for quick pivots
Industry Benchmarks
Burn Rate by Industry
Technology Startups:
- Pre-revenue: $15K - $75K/month
- Early traction: $50K - $200K/month
- Growth stage: $200K - $1M+/month
SaaS Companies:
- Target: 6-12x monthly recurring revenue (MRR)
- Optimal: Achieve 18+ months runway
- Growth efficiency: <$1.50 burn per $1 new revenue
E-commerce:
- Seasonal variations: 25-50% burn rate fluctuation
- Inventory considerations: Factor in working capital needs
- Growth stage: Focus on contribution margin per order
Professional Services:
- Lower burn rates due to people-focused model
- Target: 3-6 months of expenses in cash reserves
- Scaling challenge: Maintaining margins while growing
Warning Signs
Immediate Action Required:
- Runway less than 6 months
- Burn rate increasing faster than revenue growth
- Customer acquisition cost exceeding lifetime value
- Multiple months of increasing burn without revenue growth
Medium-term Concerns:
- Runway less than 12 months without clear funding plan
- Burn rate not decreasing as revenue scales
- High employee turnover increasing replacement costs
- Market contraction affecting revenue stability
Best Practices for Burn Rate Management
- Monthly Tracking
- Calculate burn rate consistently each month
- Create rolling 3-month and 12-month projections
- Track trends and identify patterns
- Communicate results to leadership team
- Scenario Planning
- Model best-case, worst-case, and likely scenarios
- Plan for revenue fluctuations and market changes
- Develop contingency plans for different runway scenarios
- Stress test assumptions regularly
- Investor Communication
- Provide transparent burn rate reporting
- Explain variances from projected burn rates
- Demonstrate progress toward profitability milestones
- Show evidence of burn rate optimization efforts
- Strategic Decision Making
- Use burn rate data to prioritize investments
- Balance growth initiatives with runway preservation
- Time hiring decisions with revenue milestones
- Make data-driven decisions about market expansion
Need help optimizing your burn rate and cash flow management? Schedule a consultation with our financial planning experts at Business Initiative.
Stay informed about business strategies and tools by following us on X (Twitter) and subscribing to our newsletter.
FAQs - Frequently Asked Questions About Burn Rate

What is considered a healthy burn rate for startups?
A healthy burn rate depends on your business stage and funding situation. Pre-revenue startups should aim for 12-18 months of runway, while post-revenue companies should target 18-24 months, aligning burn rate with path to profitability.
Learn More...
Pre-revenue startups typically maintain higher burn rates while building product and initial market traction, but should ensure 12-18 months of runway to reach revenue milestones or next funding round. Focus on capital efficiency and milestone achievement rather than absolute burn rate amounts.
Post-revenue companies should target 18-24 months of runway with burn rates that demonstrate clear progress toward profitability or significant growth milestones. Revenue growth should outpace burn rate increases, showing improving unit economics and sustainable business development.
Growth-stage companies may maintain higher burn rates for strategic initiatives like market expansion, but should demonstrate clear ROI on increased spending. Investors expect efficient capital deployment with measurable returns on burn rate investments and progress toward profitability or exit readiness.
How often should I calculate and monitor my burn rate?
Calculate burn rate monthly for standard monitoring and weekly during critical periods like fundraising or major operational changes. Create rolling 3-month projections to identify trends and enable proactive financial management.
Learn More...
Monthly calculation provides baseline monitoring and trend analysis, essential for runway projections and investor reporting. Track both gross and net burn rates to understand operational efficiency and cash consumption patterns. Monthly reviews enable strategic adjustments and early problem identification.
Weekly monitoring becomes critical during fundraising periods, major expense changes, or when runway drops below 12 months. This frequency enables rapid response to unexpected changes and provides detailed data for investor discussions and strategic decision-making.
Rolling projections (3-6 months forward) help anticipate future cash needs and identify potential issues before they become critical. Include seasonal variations, planned expenses, and growth initiatives in projections for comprehensive financial planning.
What's the difference between gross and net burn rate?
Gross burn rate represents total monthly expenses regardless of revenue, while net burn rate subtracts monthly revenue from expenses, showing actual cash consumption. Net burn rate is more useful for runway calculations.
Learn More...
Gross burn rate measures operational efficiency and spending discipline, showing total monthly cash outflows regardless of revenue generation. This metric helps evaluate operational leverage, cost structure optimization, and spending patterns independent of revenue fluctuations.
Net burn rate provides the most accurate runway calculation by accounting for revenue generation offsetting expenses. This metric shows actual cash consumption and is critical for fundraising discussions, investor reporting, and strategic planning around cash management.
Both metrics serve different purposes: gross burn rate for operational optimization and cost control, net burn rate for runway planning and investment timing. Companies should track both to understand operational efficiency and cash consumption patterns comprehensively.
When should I be concerned about my burn rate?
Be concerned when runway drops below 12 months without clear funding plans, burn rate increases faster than revenue growth, or you're burning cash without measurable progress toward key business milestones.
Learn More...
Critical warning signs include runway declining below 12 months without active fundraising, burn rate increases exceeding revenue growth rates, or lack of progress toward key milestones that justify increased spending. These situations require immediate strategic intervention and financial planning.
Emergency situations require immediate action: runway below 6 months, inability to secure additional funding, rapid burn rate increases without corresponding revenue growth, or fundamental business model challenges affecting long-term viability.
Regular monitoring prevents emergency situations: track burn efficiency metrics, compare actual vs. projected burn rates, monitor milestone achievement relative to spending, and maintain ongoing investor relationships for funding flexibility.
How can I reduce my burn rate without damaging growth potential?
Focus on operational efficiency improvements: automate processes, negotiate better vendor rates, eliminate unused subscriptions, and optimize marketing spend. Prioritize high-ROI activities while avoiding cuts to revenue-generating investments.
Learn More...
Operational optimization offers burn rate reduction without growth impact: process automation, vendor negotiation, software consolidation, and administrative efficiency improvements. These changes often improve long-term scalability while reducing immediate costs.
Strategic cost prioritization focuses resources on highest-impact activities: concentrate marketing spend on best-performing channels, prioritize sales activities with shortest payback periods, and eliminate low-ROI initiatives. This approach maintains growth momentum while improving capital efficiency.
Revenue acceleration can reduce net burn rate without cutting expenses: improve sales conversion rates, increase average contract values, accelerate customer onboarding, and expand existing customer relationships. Growing revenue often provides more sustainable burn rate improvement than cost reduction alone.
Should I include one-time expenses in burn rate calculations?
Calculate both versions: include one-time expenses for runway calculations, but track normalized burn rate (excluding one-time items) for trend analysis and benchmarking to understand sustainable operational patterns.
Learn More...
Runway calculations should include all expenses, including one-time items, to provide accurate cash consumption projections. This ensures realistic planning for fundraising needs and cash management during periods with significant one-time expenses.
Normalized burn rate (excluding one-time items) provides better trend analysis and benchmarking data. This metric helps identify underlying operational efficiency trends, compare performance across periods, and communicate sustainable operational patterns to investors.
Transparent reporting includes both metrics: present normalized burn rate for trend analysis while acknowledging one-time expenses for complete financial picture. This approach builds investor confidence in management's financial sophistication and planning capabilities.
How does burn rate affect fundraising success and investor decisions?
Investors closely examine burn rate trends, runway projections, and capital efficiency. High but efficient burn rates generating proportional growth can be positive, while uncontrolled spending raises serious concerns about management discipline.
Learn More...
Burn rate efficiency demonstrates management capability and strategic thinking. Investors evaluate whether increased spending generates proportional returns through revenue growth, customer acquisition, or strategic positioning. Efficient capital deployment indicates scalable business models and experienced leadership.
Fundraising timing depends heavily on runway management: start fundraising 6-9 months before runway depletion for seed rounds, 9-12 months for Series A and beyond. Longer runway provides negotiating leverage and reduces pressure that leads to unfavorable terms.
Burn rate projections must align with funding requests and milestone achievement plans. Investors expect detailed explanations of how additional capital will be deployed, expected returns on increased burn rate, and clear paths to profitability or next funding milestones.
What are good burn rate efficiency metrics for different business models?
SaaS companies should target burn multiples under 2x (burning <$2 per $1 of new MRR), while other business models focus on customer acquisition cost payback periods, revenue per employee, and capital efficiency ratios specific to their industry.
Learn More...
SaaS companies use burn multiple (net burn rate ÷ new monthly recurring revenue) as a key efficiency metric. World-class companies achieve 1x or lower, while 2x or higher indicates need for improvement. This metric directly correlates capital consumption with revenue growth.
E-commerce and marketplace businesses focus on customer acquisition cost (CAC) payback periods and lifetime value ratios. Efficient companies achieve CAC payback within 12-18 months with LTV/CAC ratios above 3:1, indicating sustainable unit economics and capital efficiency.
B2B service businesses emphasize revenue per employee and utilization rates as burn efficiency indicators. High-efficiency companies achieve $200K+ revenue per employee with strong utilization rates, demonstrating operational leverage and scalable business models.
Resources and Additional Information
🧮 Related Financial Calculators
- Funding Need Calculator - Determine how much capital your business needs
- Cash Flow Forecast Calculator - Project future cash positions
- Cash Reserve Ratio Calculator - Calculate optimal cash reserves
- Startup Cost Calculator - Estimate initial business expenses
- Business Survival Probability Calculator - Assess long-term viability
- Operating Cash Flow Calculator - Analyze cash from operations
- EBITDA Calculator - Comprehensive earnings analysis
- TAM Calculator - Total Addressable Market analysis
📚 Financial Management Guides
- Small Business Survival and Failure Rate Statistics
- Corporate Finance and Cash Flow Management
- LLC Financing Options for Entrepreneurs
- LLC Financial Management Best Practices
- Discounted Cash Flow Valuation Guide
🏢 Business Planning Resources
- How Long Does it Take to Start a Small Business?
- Business Models and Revenue Strategies
- Total Addressable Market Analysis Guide
- Cost Plus Pricing Strategy
🔧 Business Tools and Resources
- Business Initiative: Complete Tools Suite
- Market Opportunity Finder
- Market Segmentation Analyzer
- Burn Rate FAQs - Frequently Asked Questions
📖 Financial Terms Glossary
- Burn Rate: The rate at which a company spends its cash reserves
- Runway: How long a company can operate before running out of money
- Cash Flow: The movement of money in and out of a business
- Working Capital: Current assets minus current liabilities
- EBITDA: Earnings Before Interest, Taxes, Depreciation, and Amortization
- Break-even Point: When total revenue equals total costs
